Have you ever wondered why some dashboards make data easy to act on, while others just sit there looking pretty but confusing? The answer comes down to how the dashboard UI is designed and how the dashboard interface design supports decision making.
In this article, we explain what a dashboard UI is, why it matters to your business, and how good interface design helps people trust and use data with confidence. We also look at common mistakes, practical design principles, and real examples of dashboards that work in day-to-day business situations.
What Is a Dashboard UI and Why It’s Important
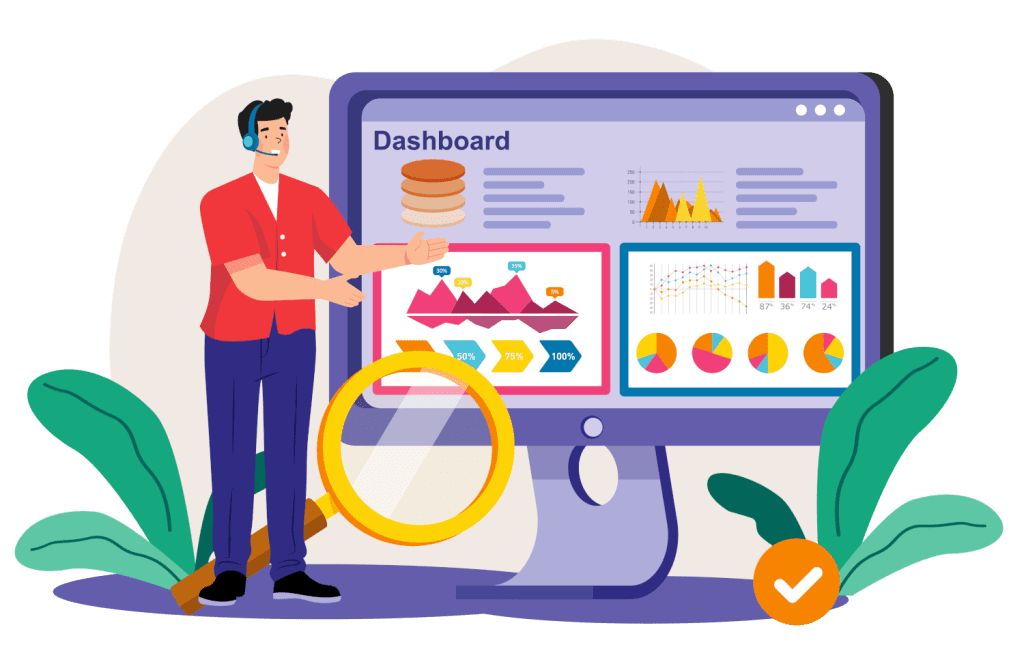
A dashboard UI is the part of a dashboard that people see and use on screen. It includes the layout of charts, figures, menus, and controls that allow users to view information and interact with it. The dashboard itself sits inside a piece of software and brings together important data in one place.
Most business software systems store large amounts of data behind the scenes. Sales platforms, finance systems, and operational tools all collect information constantly. The dashboard UI is the layer that turns this raw data often retrieved from a database into something visual and usable. Without it, users would be left looking at tables of numbers or individual records, which are slow and difficult to interpret.

This means dashboard interface design is about more than appearance. It determines how information is presented, how easy it is to follow, and whether people can understand it without extra effort.
When the UI is designed properly, users can see patterns, spot changes, and understand performance quickly. This supports everyday decisions as well as longer term planning, helping the business respond sooner and more confidently.
Why Good Dashboard UI Isn’t Optional
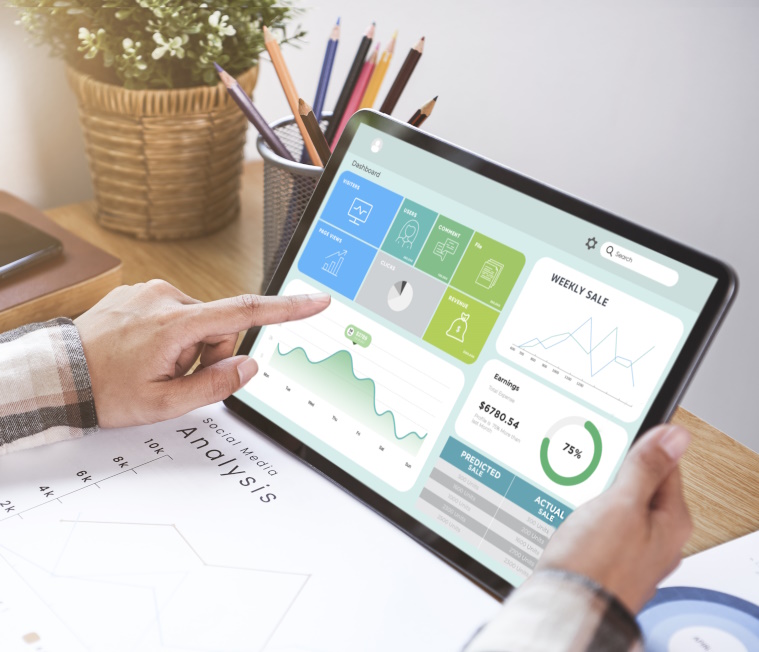
Imagine opening a spreadsheet with 200 rows and 30 columns. Lines of numbers, headings, and codes fill the screen. Technically, all the information might be there, but finding anything useful takes time and effort. If that were your dashboard, you would avoid using it unless you had no other choice.
A strong dashboard UI changes how people behave around data. Instead of avoiding complex screens, users are more willing to engage, explore, and act. The information feels manageable, and important changes are easier to notice without extra analysis.
For example:
- A chart showing last month’s sales next to this month’s, so change is obvious straight away.
- Traffic light colours that signal where performance is on track and where attention is needed.
- Key figures shown with context, such as targets or previous results, so you know whether the number is good, average, or a warning sign
Poor UI dashboard design causes more problems than many people realise. It does not just look untidy. It slows people down, increases the chance of mistakes, and reduces trust in the data. When screens are cluttered, users hesitate. They double check things. They export data into spreadsheets to “be sure”. That adds time and frustration, and often leads to different people working from different versions of the truth.
Weak dashboard interface design can also hide important signals. If critical figures are buried among less important ones, problems may go unnoticed until they are larger and harder to fix. Over time, people may stop relying on the dashboard at all, which wastes the effort that went into building the system.
Common Dashboard Mistakes (And How to Fix Them)
Even when teams have good data, dashboards can fail because of design choices. These mistakes are usually not technical problems, but issues with layout, focus, and visual structure. Here are four you can learn from:
🟥 Too Much Information at Once
A dashboard that shows every metric you can think of becomes overwhelming. Choose only the most important data points. Fewer, clearer items help people act faster.
🟦 No Clear Flow or Layout
If your eyes jump around the screen, the layout isn’t helping. A strong UI dashboard design guides the viewer from the most important figures down to supporting detail.
🟨 Bad Chart Choices
Not all charts are equal. Some hide trends instead of showing them. Pick charts that match the data: trend lines for progress over time, bar charts for comparisons, and tables for precise numbers.
🟩 Cluttered Colours and Fonts
Too many colours, fonts, or flashy elements distract people from what matters. Good dashboard interface design simplifies visual noise so performance stands out.
| Problem | Effect | Better Alternative |
|---|---|---|
| 🟥 Too Much Information at Once | Overload, confusion | Focused key figures |
| 🟦 No Clear Flow or Layout | Eyes jump around | Logical placement |
| 🟨 Bad Chart Choices | Misleading view | Right chart type |
| 🟩 Cluttered Colours and Fonts | Distracts user | Clean, simple style |
How to Choose the Right Metrics for Your Dashboard UI
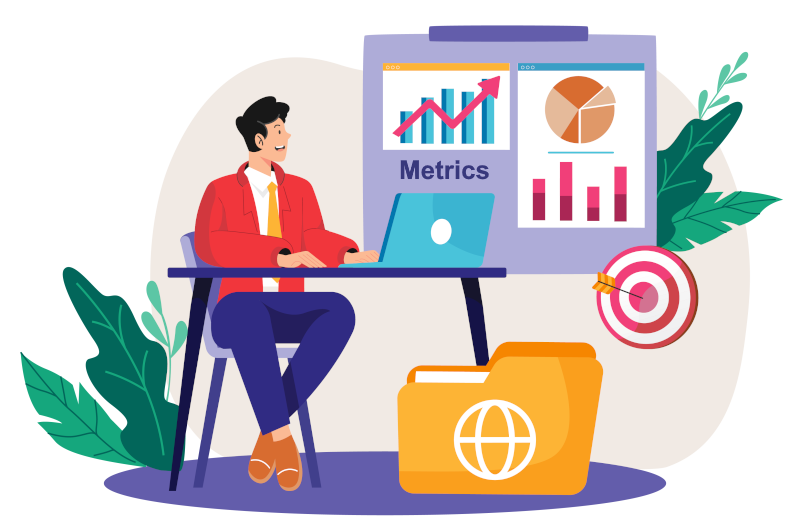
Metrics are the heart of any useful dashboard, they turn raw data into signals you can act on. In software, metrics are measurable figures that show how part of your business or product is performing, such as sales totals, system response times, stock levels, or user activity. A dashboard without well-chosen metrics is like a gauge without a needle, it looks complete, but it doesn’t tell you anything useful.
Without metrics, a dashboard would just be an empty frame. With the right ones, it becomes a control panel for the business. Metrics help you see where things are going well, where there are issues, and where action is needed. They turn everyday activity recorded in software into clear signals for decision making.
Your dashboard UI should show metrics that:
- 🎯 Link clearly to business goals, so you are tracking what really matters
- ❔ Help answer two simple questions, what has happened and what should we look at next
- 🔄 Update regularly, so the picture reflects what is actually going on, not last quarter’s situation

When thinking about dashboard interface design, it helps to group metrics into two main types. Each plays a different role.
1) Outcome Metrics
Outcome metrics show the end results of your business activity. They tell you where you currently stand. These are often the figures discussed in meetings because they reflect overall performance.
2) Performance Metrics
Performance metrics track the activities and processes that lead to those results. They help you understand what is driving outcome metrics.
If you’d like a deeper guide on selecting and using the right metrics for your business and software, check out our full post on Metrics that Matter.
Principles of Excellent Dashboard Interface Design
The goal is not to simplify for the sake of it, but to make sure each element earns its place on the screen. When they are ignored, the same data can feel stressful or confusing, even if the numbers are correct.
Here are four core principles:
Clarity Over Complexity
The purpose of a dashboard is not to show everything; it is to show what matters most. Clarity means highlighting key figures and making labels plain and direct. Instead of long technical terms, use wording people recognise from daily work. Important numbers should stand out through size, position, or spacing, not through bright colours alone. A clear UI dashboard design reduces hesitation. People should not have to stop and think about what they are looking at before they can use it.
Consistent Visual Patterns
When similar information is always shown in a similar way, the brain learns the pattern. For example, if revenue is always shown as a blue bar chart and costs are always shown as a red one, users quickly recognise which is which. If colours, chart types, or labels change from screen to screen, people slow down and may misread information. Consistency in dashboard interface design builds familiarity and confidence over time.
Logical Grouping
Information should be arranged in meaningful sections. Sales figures belong together. Operational measures belong together. Financial summaries belong together. This structure mirrors how people think about the business. Good grouping in a dashboard UI helps users move from one area to another in a natural order, instead of jumping randomly across the screen.
Feedback and Interaction
A dashboard should respond to the person using it. If someone changes the date range, filters by region, or selects a product line, the dashboard should update clearly and quickly. This interaction makes the dashboard feel like a tool, not just a report. Strong UI dashboard design allows people to explore safely without breaking anything, which leads to better understanding.

These principles are based on behaviour, not theory. They make dashboards feel supportive and usable, rather than technical or intimidating.
Examples of UI Dashboard Design That Works
It helps to picture these ideas in real situations. Below are four examples showing how a dashboard UI can be designed to support everyday business decisions.
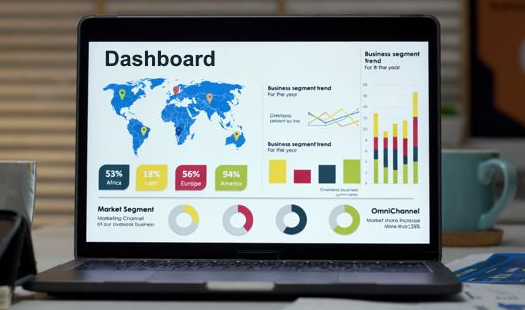
1) Sales Performance Dashboard
This dashboard focuses on how well products or services are selling.
| 📈 Monthly revenue trend |
| Shown as a line chart across the top of the screen, this gives an instant view of whether income is rising, steady, or falling. Placing it at the top makes it the first thing people see, which matches its importance. |
| 📈 Best selling products |
| Displayed as a ranked bar chart, this helps identify which items drive most income. Clear labels and simple ordering help users compare products quickly. |
| 📈 Sales by region |
| Often shown as either a map or grouped bars, this reveals where performance is strongest or weakest. When placed below the overall trend, it explains where the numbers are coming from. |
This layout follows good dashboard interface design because it moves from overall performance to detail in a clear flow.
2) Customer Support Performance
Here the focus is service quality and responsiveness.
| 🧭 Average response time |
| A single figure with a small trend line shows whether customers are waiting longer than usual. Colour indicators can show if response time is within target. |
| 🧭 Tickets resolved today |
| This shows workload and productivity. If this number drops, it may signal staffing or process issues. |
| 🧭 Satisfaction score |
| Often shown as a percentage or rating, this reflects how customers feel about the service. When placed near response time, it helps users see links between speed and satisfaction. |
A clean dashboard UI here prevents service teams from feeling overwhelmed and helps them act quickly.
3) Operations Efficiency View
This dashboard supports the smooth running of day-to-day operations.
| ⚙️ Average delivery time |
| A trend chart shows whether deliveries are speeding up or slowing down. Sudden changes stand out clearly. |
| ⚙️ Stock levels by product |
| Often shown as bars or simple status indicators, this helps prevent shortages or overstocking. |
| ⚙️ Staff utilisation rate |
| Displayed as a percentage, this shows whether teams are overloaded or underused. |
Good UI dashboard design in this case links operational speed, stock, and workforce, helping managers see how one affects another.
4) Cash Flow Snapshot
This dashboard focuses on financial stability.
| 💷 Cash in vs cash out |
| A dual line chart compares money coming in with money going out. The gap between the lines tells an immediate story. |
| 💷 Forecast for next month |
| A projected figure gives an early warning if cash flow might tighten. |
By showing present and near future together, this dashboard interface design supports planning, not just reporting.
Each example shows how the same design principles can be applied differently depending on the type of decision being supported.
Iterative Improvement: Dashboards Are Not One-Off Projects
Dashboards should develop as the business changes. Reviewing and refining them keeps the dashboard UI relevant.

👥 Collect Feedback from Users
In a retail business, store managers might say the sales dashboard shows totals but not returns. Adding a returns figure helps them manage performance more accurately.
🛠 Review Metrics Every Quarter
In a logistics company, delivery time may be critical one year, but fuel efficiency might become more important as costs rise. Quarterly reviews ensure the dashboard reflects current priorities.

🔄 Add or Remove Charts Based on Relevance
In a software service company, a feature usage chart may be useful during a product launch, but less important later. Removing it keeps the dashboard interface design focused and uncluttered.
This ongoing adjustment keeps dashboards aligned with real work, not old assumptions.
When Custom Software Helps Dashboard UI
Off-the-shelf tools are suitable for many business situations. However, they may limit how far you can shape the dashboard UI around your own processes. Bespoke software becomes useful when the standard layout or data connections do not reflect how your business actually operates.
A tailored approach can provide:
- 💻 A dashboard that connects directly to your internal systems, so data flows automatically without manual transfers.
- 🖱️ Interactive features, such as specialised filters or drill down views, that standard tools may not offer.
- 🖥️ A layout that mirrors how your teams work, making the UI dashboard design feel natural.
Custom software becomes useful when existing tools cannot evolve easily alongside your processes. Technology alone does not make a dashboard useful. The design must still be clear and practical.
The comparison below shows that good dashboard UI design matters when designing and developing both custom and generic off-the-shelf software. It also shows that, custom software simply gives more freedom to shape the interface, metrics, and interaction around your exact needs.
A Simple Table to Compare Dashboard Tools
| Feature | Off-the-Shelf | Bespoke/Custom |
|---|---|---|
| Pre built dashboards | Yes | Depends on design |
| Tailored UI dashboard design | No | Yes |
| Unique metric support | Limited | Designed for you |
| Integration with existing systems | Often needs work | Built in |
| User control over layout | Limited | Full control |
| Long term flexibility | Moderate | High |

Final Thoughts
Good dashboard UI is no longer a nice extra. It helps people understand data, make confident decisions, and respond quickly to change. When dashboards are designed well, they become a shared reference point across the business, helping teams align around the same information and act with confidence. Data on its own has little value. It becomes valuable when people can see what it means and know what to do next. That is what effective dashboard design delivers.
If you are considering a custom software approach for your business, get in touch with BSPOKE Software. We are happy to talk through your situation and explore whether a tailored solution is right for you. Use the contact form on our website to start the conversation.